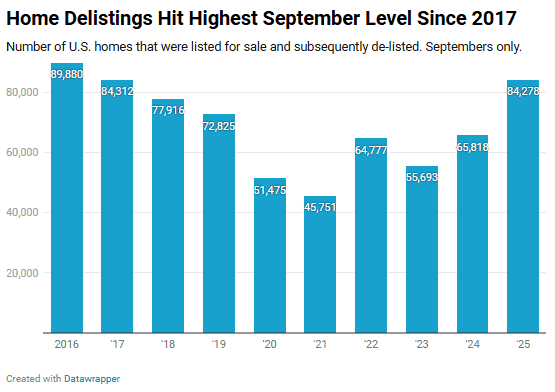
Number of homes pulled off the market rose to a historic high in September
Nearly 85,000 U.S. homeowners withdrew their properties from the market in September–up 28% from a year earlier and the highest level for the month since 2017 — according to a nationwide analysis of historical listing data compiled by Redfin. The firm reviewed delisting patterns back to 2016, defining a delisting as any property that remained off the market for more than 31 days without selling or entering into contract.
The data highlight a growing trend of sellers retreating from a cooling housing market marked by elevated mortgage rates, softening demand and swelling inventories. September also saw an unusually high share of “stale” listings: homes that had been on the market at least 60 days without finding a buyer. By Redfin’s measure, roughly 70% of active U.S. listings met that threshold, and the typical home pulled from the market had sat unsold for about 100 days.
A Multi-Year Climb in Delistings
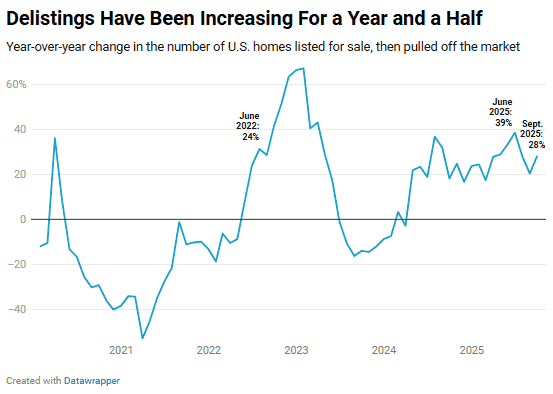
While delistings typically rise during the winter, September’s surge fits into a broader pattern: sellers have been pulling listings at increasing rates for 18 straight months. Year-over-year delistings peaked in June at 39%. A similar wave hit in 2022, shortly after borrowing costs jumped from their pandemic lows.
Why Sellers Are Backing Away
Agents and economists cite several forces behind the retreat:
- Stalled demand. High mortgage rates, record home prices and pervasive economic uncertainty–including consumer hesitation tied to the federal government shutdown–have weighed on buyer activity.
- Reluctance to take losses. About 15% of September’s delisted homes had been listed at no more than 10% above their owners’ original purchase price, placing them at risk of selling at a loss.
- The rental fallback. A growing pool of would-be sellers are opting to rent out their properties rather than accept lower bids.
- More supply overall. Active listings rose 8% year-over-year in September, the most for that month since 2019; more inventory has naturally led to more withdrawals.
“More sellers are giving up because their homes have been sitting on the market for a long time, and they don’t want to–or can’t afford to–settle for a lower price,” said Asad Khan, a senior economist at Redfin.
Delistings Now a Larger Share of the Market
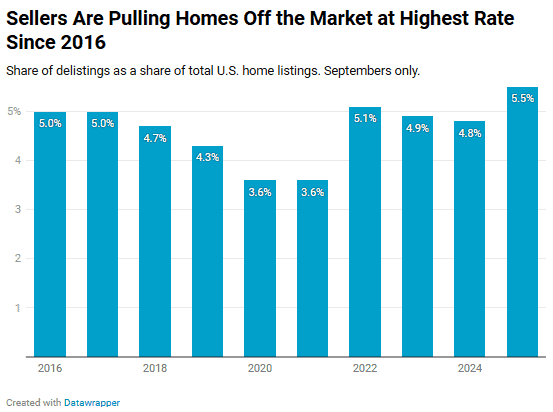
Withdrawals made up 5.5% of all U.S. home listings in September, the highest share for the month in Redfin’s records and up from 4.8% a year earlier. The increase underscores how many sellers are balking at current market conditions even as inventories expand.
Pullbacks Are Propping Up Prices
Fundamentals point toward downward price pressure–active listings rising, contract signings down 2%–but national home prices still climbed about 2% from a year earlier in September. Economists say widespread delistings are helping buoy prices by keeping functional supply tighter than raw inventory numbers suggest.
“When tens of thousands of sellers pull back rather than accept offers below their expectations, the effective supply for would-be buyers shrinks,” Khan said.
Many homeowners are not listing in the first place. New listings remain flat as owners with pandemic-era low mortgage rates assess whether selling makes sense today.
“It’s no longer a great time to sell,” said Aditi Jain, a Redfin Premier agent in Boston. “Most listings get one or two offers now, instead of 10. If sellers don’t get their number, they’d rather wait a year or two–or rent the property out.”
One in Five Delistings Reappear
Delisting is often used as a strategy rather than an exit. About 20% of homes withdrawn in July and 18% of those pulled in June were back on the market within three months, often at revised prices. Roughly one-third of relisted July homes have since sold.
Recent Buyers Are Delisting Most Often
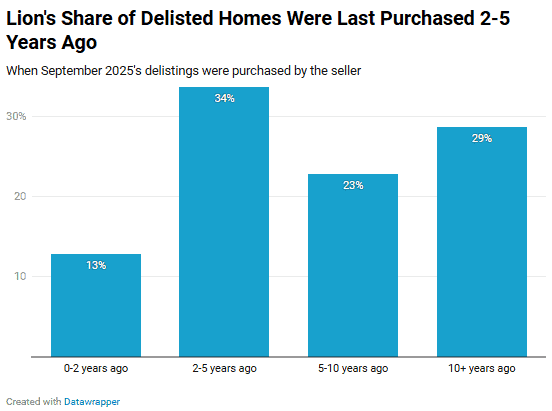
Nearly half of September’s delisted homes were owned by people who purchased within the past five years. That group is disproportionately likely to withdraw: only 37% of all active listings nationwide are owned by such recent buyers.
Pandemic-era purchasers often carry sub-3% mortgage rates and still expect 2021-style bidding wars, economists say. Many are testing the market rather than needing to move. By contrast, longtime homeowners–with more equity and clearer relocation timelines–are generally more motivated to sell.
Where Delistings Are Surging
Among the nation’s 50 largest metropolitan areas in September:
- Biggest annual increases: Virginia Beach (+74.5%), Washington, D.C. (+53.9%), San Jose (+53.3%), Dallas (+52.1%) and Houston (+49.6%).
- Where delistings declined: St. Louis (-12.4%), Nassau County, N.Y. (-7.2%) and Chicago (-1%).
- Highest share of delistings: Miami (7.8%), followed closely by Fort Lauderdale, Dallas, Philadelphia and West Palm Beach (all about 7.5%).
- Lowest share: Pittsburgh (3.4%), Milwaukee (3.5%), Columbus (3.6%), Cincinnati (3.7%) and Chicago (4.1%).
- Most stale listings: Miami and Fort Lauderdale (both 84.6%), Austin (82.8%), West Palm Beach (82%) and San Antonio (81.2%).
- Least stale: San Jose (44.2%), San Francisco (45.9%), Boston (48.9%), Providence (49.1%) and Milwaukee (49.2%).